Recover 1-4% of gross margin from the pricing decisions you already make, without losing a single unit of volume.
Typical mid-market wholesale or distribution business recovers 1-4% of gross margin in the first twelve months. No volume loss, because the recommendations are tuned against elasticity, not applied blind.
Sales reps see the margin impact of every exception before they commit. Price-down decisions move from habit to conscious trade-off, and the category team can see the cumulative cost of the discount book.
Pricing reviews shift from a once-a-year political exercise to a weekly operating rhythm. Cost increases flow through in days, not quarters. Tender prices stop ageing in silence.
Every recommendation, every approval, every override is logged against the person who made it and the margin impact at the time. Finance stops hunting for explanations after the close.
A pricing analytics system that reads every SKU, customer, and channel in your ERP, flags where margin is leaking, and puts recommended price moves in front of your category managers for approval. Built for Australian mid-market wholesalers, distributors, and retailers. Recommendations go to humans. Approved changes go to the ERP. No auto-pricing.
Most mid-market wholesalers and retailers in Australia still set prices the same way they did a decade ago. A cost-plus spreadsheet. An annual review. A sales rep with discount authority and a quota. Tender prices that haven't been looked at since the contract was signed. The category manager knows the top 200 SKUs cold and trusts the other 8,000 to the formula.
That worked when input costs moved once a year. It does not work now. Freight has moved four times in two years. Suppliers push through cost increases monthly. Sales reps discount to hold volume. Nobody owns the long tail.
The margin leak is real, and it is invisible in the P&L until the half-year close. By then the 2% is gone and the CFO is the one who has to explain it to the board.
Your category team already has the data. It sits in NetSuite, Pronto, MYOB Advanced, SAP Business One, or whichever ERP runs your business. The problem is that nobody has the time, the model, or the tooling to look at all of it every week.
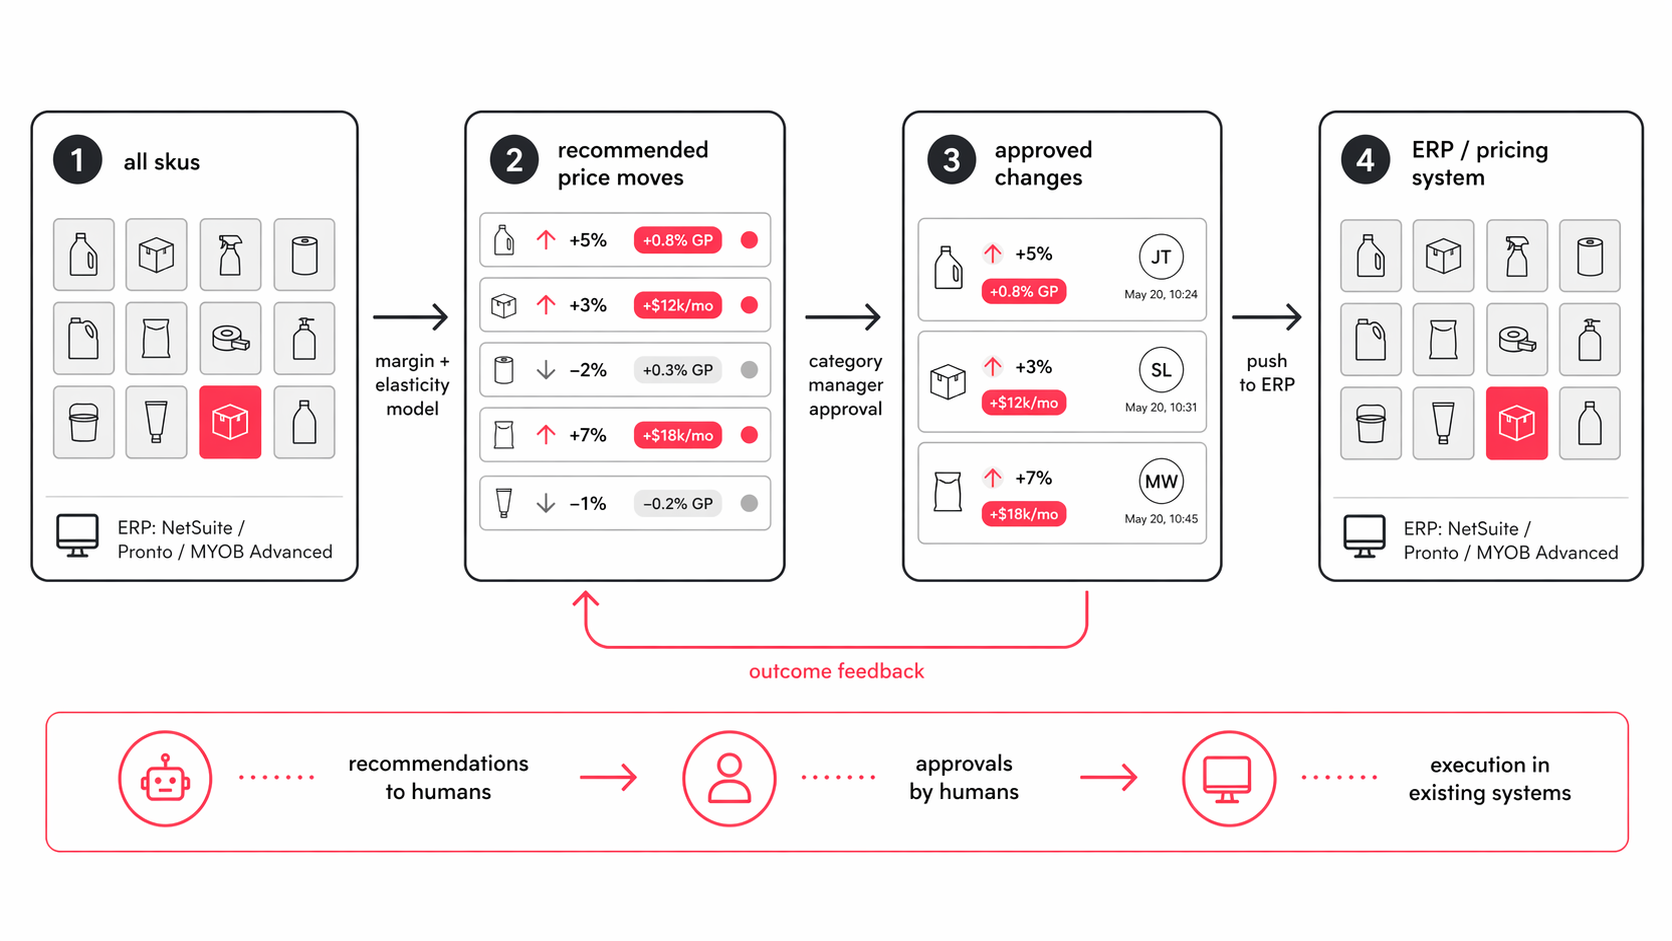
We connect the ERP into an AIS, layer a margin-and-elasticity model on top, and deliver a weekly queue to your category managers. The queue lists the SKUs, customers, and channels where pricing action is due, with a recommended move and the margin impact of making it. Your category manager reviews, approves, edits, or rejects. Approved changes flow back to the ERP. Every decision is logged. Nothing auto-applies.
Eight leaks we see across almost every mid-market wholesaler, distributor, and multi-site retailer we look at. The ranges are rough, drawn from the pattern of engagements rather than any single client.
| Leak type | What it looks like | Rough impact on GP% |
|---|---|---|
| Orphan discounts | One-off discounts granted years ago that nobody has reviewed since | 0.2-0.8% |
| Price-point drift | Floor prices eroded by small manual overrides that compound | 0.3-1.0% |
| Cost-increase lag | Supplier cost rises that took 60-120 days to reflect in sell price | 0.5-1.5% |
| Freight recovery gaps | Freight charged to the business but not passed through on mixed-freight customers | 0.2-0.6% |
| Cross-customer price variance | Two similar customers on materially different prices with no defensible reason | 0.2-0.7% |
| Promo spillage | Promotional prices that quietly stayed live after the promo window closed | 0.1-0.5% |
| SKU tail neglect | The 80% of SKUs the category team doesn't have time to review | 0.3-1.0% |
| Tender price obsolescence | Contract prices that haven't moved since signature, while costs have | 0.4-1.2% |
Most businesses leak from six of the eight at once. The model finds them all in the first pass.
Connect your ERP, cost feeds, and customer master into the AIS as the single source of pricing truth.
Build a margin model at SKU, customer, and channel level, calibrated on the last 24 months of trading.
Run an elasticity layer on the lines that move enough volume to measure, flagging the rest as rules-based.
Generate a weekly queue of recommended price moves with margin impact, volume risk, and rationale per item.
Route the queue to the right category manager with approval, edit, or reject on each line.
Push approved changes into the ERP or pricing system with a full audit trail.
Feed the outcome of every approved change back into the model so next week's recommendations get sharper.
Predictive models, recommendation systems, forecasting, and MLOps, delivered with a ruthless ROI focus.
Learn moreThe operating layer your AI, automation, and analytics run on. Deployed in two weeks.
Learn moreClose the gap between what your data knows and what your business does. The architecture from insight through decision to action.
Learn moreSKU-level demand forecasts that feed replenishment directly, so planners manage exceptions instead of rebuilding spreadsheets every Monday.
10–20%
reduction in working capital tied to inventory
Score every lead and account by likelihood to convert, then push the ranked list into the CRM your reps already open.
40%
YoY revenue lift, same sales team
30-minute call, no slides, no obligation. We'll tell you plainly whether this is the right fit for what you're trying to do.
Cookie preferences
We use essential cookies to run the site. With your permission, we also use analytics cookies to understand what content helps visitors make better data and AI decisions.