Predictive Maintenance & Asset Intelligence

    National Mining Operator

    “We had a bunch of reports, but nothing really proactive, and nothing connected. Now we just ask anything we need to know, and bang — the right answer just… appears.”

    Chief Operating Officer, Queensland

    Your CMMS already knows which assets are about to fail. Ask it.

    Predictive Maintenance & Asset Intelligence turns the maintenance logs, work-order history, and asset register a business already holds into forecasts of failure windows, parts demand, and true total cost of ownership. It runs on the data in your CMMS and spreadsheets. It does not require new IoT sensors, rip-and-replace systems, or a data science team to operate.

    The Problem

    What usually breaks

    3am at a regional mine site. A pump truck drops on a bench twenty kilometres from the workshop, and the shift supervisor's phone rings. The parts bin has the wrong impeller. The on-call fitter is an hour out. Production loses the shift.

    None of this was a surprise to the maintenance log. The same unit had thrown the same fault code twice in the previous six weeks, buried in free-text notes from two different fitters on two different rosters. Nobody joined the dots, because joining the dots was somebody's Saturday job in Excel that never quite happened.

    Most mid-market operators sit on five to ten years of maintenance history and still plan parts and shutdowns off OEM schedules and gut. The data is there. The pattern is there. The operating rhythm to act on it is the gap.

    In Your Business

    How this lands inside your operation

    You run Pronto, Mainpac, IFS, or something similar, with a decade of work orders inside it and another decade of paper that got scanned in. The planner's Monday morning looks like a spreadsheet of overdue services and a stockroom that holds eight months of an impeller you last used twice. Fitters write good notes. Nobody reads them at scale.

    What we build sits on top of that. A model scores each asset weekly for failure risk, predicts parts demand over the next 90 days, and quantifies true total cost of ownership per unit and class. The output lands where your planners already work, as a ranked queue with the recommended action next to it. No new interface for the fitters. No new process for the stores team. The CMMS stays the system of record.

    This is for you if…

    • COOs and heads of maintenance at Australian mid-market mining, utilities, transport, manufacturing, and waste operators.
    • Businesses with a CMMS (Pronto, Mainpac, IFS, SAP PM, Maximo, or similar) and at least three years of work-order history.
    • Operations leaders whose spares working capital is visibly too high and whose planners still work out of Excel.
    • Finance teams who want maintenance spend forecasts that hold up in a board pack.

    This probably isn't the right fit if…

    • Operations with less than six months of maintenance log data. Instrument and log first.
    • Businesses looking to buy IoT sensors. Start with the data you already have.
    • Single-asset owners without a fleet population to learn from.
    How It Works

    The engagement, step by step

    1. 1

      Pull maintenance logs, work orders, asset registers, and parts history out of the CMMS and any spreadsheets alongside it.

    2. 2

      Clean and standardise free-text fault descriptions so "bearing noise" and "brg nse" become the same signal.

    3. 3

      Train models per asset class on time-to-failure, parts consumption, and cost-per-hour-of-runtime.

    4. 4

      Score every asset weekly; rank by expected cost of inaction over the next planning horizon.

    5. 5

      Route the ranked queue into the planner's existing view in the CMMS or the Monday morning report.

    6. 6

      Feed back every completed work order so the model sharpens on your fleet, not a textbook one.

    7. 7

      Review TCO by asset class quarterly to inform replace-versus-repair and next capex.

    Scope

    What we model and what we don't

    Predictive maintenance is not magic, and it is not universal. A model needs a pattern to learn from and a decision it can change. The honest version of the scope looks like this.

    Asset classWorth modelling?Why
    Crushers and millsYesHigh consequence, rich fault history, expensive unplanned stops.
    Centrifugal and slurry pumpsYesWell-instrumented in logs, clear wear signatures, strong parts-demand signal.
    Haul trucks and heavy vehiclesYesYears of CMMS history, telemetry available, expensive downtime.
    Conveyors (drives, idlers, belts)YesFailure modes are patterned, parts demand is forecastable.
    HVAC plant at scaleYesEnough units and enough log depth to generalise, clear cost of failure.
    Air compressors (industrial)YesRuntime hours and duty cycles are good predictors, parts consumption is regular.
    Medium-voltage transformersYesFailures are rare but catastrophic; oil analysis and load history carry real signal.
    Low-cost commodity parts (filters, lamps, hoses)NoCheaper to replace on a calendar than to model.
    Assets with under six months of log dataNoNot enough history to learn a pattern. Instrument first, model later.
    Anything under a watertight OEM warrantyNoThe economics already sit with the OEM. Do not pay twice.
    One-off bespoke rigsNoFleet of one. No population to learn from.
    Assets the business is retiring in 12 monthsNoPayback window is shorter than the build.

    If your fleet sits mostly in the top block, the work pays back inside a year. If it sits mostly in the bottom block, we will tell you that on the first call.

    Outcomes

    What changes once this is in

    15% reduction in overstocked spare parts

    A National Mining Operator in Queensland released 15% of tied-up spares working capital once parts demand was driven by predicted failure windows, not historical averages and OEM recommendations.

    Unplanned downtime down, planned work up

    Failure windows forecast weeks ahead mean interventions slot into scheduled shutdowns. Reactive call-outs drop. Your fitter roster starts to look like a plan, not a fire roster.

    Defensible capital decisions

    Total cost of ownership becomes a number per asset, not a feeling. Replace-or-repair conversations run on evidence, and the regret buys that haunt most fleets get visible before the PO is raised.

    Cashflow that matches the workshop

    Maintenance spend forecasts stop being "last year plus five per cent". Finance sees parts and labour demand 60 to 90 days out, and the cashflow model gets a lot less surprised.

    Proof

    What this looks like in the field
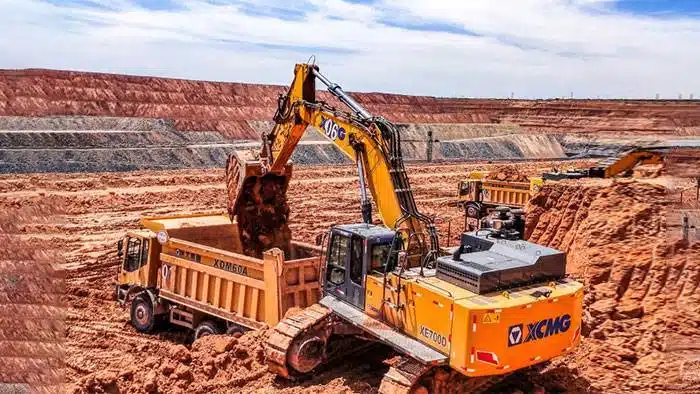
    Heavy mining equipment on site

    National Mining Operator

    Mining

    “We had a bunch of reports, but nothing really proactive, and nothing connected. Now we just ask anything we need to know, and bang — the right answer just… appears.”
    • 15% reduction in overstocked spare parts
    • Risk of incorrect asset purchasing decisions significantly mitigated with clear total cost of ownership
    • Cashflow forecast reliability boosted with visibility of true maintenance needs beyond OEM schedules
    Read the full study
    Common Questions

    Frequently asked

    Let's talk about Predictive Maintenance & Asset Intelligence.

    30-minute call, no slides, no obligation. We'll tell you plainly whether this is the right fit for what you're trying to do.

    Cookie preferences

    We use essential cookies to run the site. With your permission, we also use analytics cookies to understand what content helps visitors make better data and AI decisions.